Sunday, September 30, 2012

inspiration


 ART OF THE FEDERAL HEART PROJECT by Dan Cassaro

Poster for Friends of Typeby Dan Cassaro 


Louie by Jon Contino

 Sven Hoffmann by Jon Contino

 
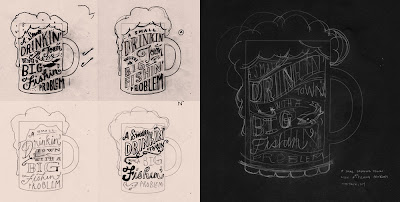
hand drawn type work process Jon Contino 


I know these are not related to infographics, but I thought these might be helpful for some of the early assignments. 

Thursday, September 27, 2012

plotting data


This is another website where you can plot data and export your graph/chart as a pdf file.

daytum


If you are having problem plotting an accurate data for your infographic, this app/website might be helpful. This is a tool for counting and communicating your personal statistics. You punch in the data and the web will create your graphic accordingly. One of the cool features is the variety of options for presenting your data (horizontal bars, spark bars, pie, stacked lines, timeline and many more)


infographics (more updated)


ASSIGNMENT 4

Infographic
1) In this session, we'll critique your New York Times responses from last week. Based on class suggestions, you will be expected to improve upon them for next week.

2) Infographics have become an essential and quite interesting graphic form, especially during the last ten years. Data visualization is essentially a new language, that, as designers, we have the power to shape. We'll look at infographics and discuss how they are developed both topically in terms of research and how they are rendered visually. We'll also discuss what topics you might consider for your infographic.

3) For next session, you'll create a data set. Based on your data set, you'll create an infographic that is both informational and beautiful.

Sunday, September 23, 2012

one of the few ways to present interactive design


Check out this guys website to see how he presents his interactive/web related portfolio. This should be helpful for our next assignment(infographic) as well.

inspiration: type and lettering


and last but not least,


Saturday, September 22, 2012

Thursday, September 20, 2012

ASSIGNMENT 3

For next week, drawing on ten different articles from a section of The New York Times, you'll create visual responses.


O B J E C T I V E S :

We want to know what interests you by seeing which article you choose from tomorrow’s issue of The  New York Times. We want to see your visual style and your ideas in your responses.


P A R T I C U L A R S :

1)    choose ten different articles from The New York Times for your responses
2)
    choose ten crucial sentences from each of your ten different articles as 
      “bounce off” sentences for your responses
3)
    choose imagery, typography, and language that clearly states your idea
4)
    choose ten crucial sentences from each of your ten different articles 
      (begin with image, type, and color swipe and post your swipe on your blog)
5)
    create your responses. your responses may take any visual form 
      (book covers, posters, etc.)
6)
    ten first drafts are due next week
7)
    be prepared to present your work 


We will also critique your final draft of your bucket list. You'll make adjustments for the following week based on in-class suggestions. 

Monday, September 17, 2012

tips-for-setting-your-rates

http://thefreelancestrategist.com/tips-for-setting-your-rates/1867